“In Florida — which continues to make itself a supply magnet with strong demand + the boost from the new Live Local legislation — three markets (Fort Myers, Sarasota, Daytona Beach) are seeing Class C rent cuts around 10-12%. “
Yes, when you build “luxury” new apartments in big numbers, the influx of supply puts downward pressure on rents at all price points — even in the lowest-priced Class C rentals. Here’s evidence of that happening right now:
There are 12 U.S. markets where Class C rents are falling at least 6% year-over-year. What is the common denominator? You guessed it: Supply. All 12 have supply expansion rates ABOVE the U.S. average.
In Florida — which continues to make itself a supply magnet with strong demand + the boost from the new Live Local legislation — three markets (Fort Myers, Sarasota, Daytona Beach) are seeing Class C rent cuts around 10-12%. Not shown on this Top 12 list, but there are three large Florida markets with high supply also seeing Class C rent cuts of 4-5%: Orlando, Jacksonville and Tampa.
Other key markets nationally to highlight: Ultra-high-supplied big markets like Austin, Phoenix, Salt Lake City, Atlanta and Raleigh/Durham are all seeing sizable Class C rent cuts of at least 6%. Small markets on the list include Myrtle Beach, Wilmington NC, Boise and Colorado Springs.
Bear in mind that apartment demand is NOT the issue in any of these markets. They’re all demand magnets. Sure, they’ve seen some moderation / normalization for in-migration and job growth, but they’re still ranking among the national leaders for net absorption.
Simply put: Supply is doing what it’s supposed to do when you add an awful lot of it. It’s a process academics call “filtering” — which happens when higher-income renters in Class B apartments move up into higher-priced new Class A units … and then Class B units see vacancy increase, so they cut rents to lure up Class C renters. And down the line it goes.
But filtering works best when we build a lot of apartments. We didn’t see this phenomenon play out as clearly in past cycles when supply was relatively limited — and (crucially) failed to keep pace with demand.
Less anyone still in doubt, here’s another factoid: Where are Class C rents growing most? You guessed it (I hope!) — in markets with little new supply. Class C rent growth topped 5% in 18 of the nation’s 150 largest metro areas, and nearly all of them have limited new apartment supply. That list includes markets like: Midland/Odessa TX, Knoxville TN, Grand Rapids MI, Dayton OH, Wichita KS, Buffalo NY, Louisville KY, Little Rock AR, and Albany NY.
Among larger markets, Cincinnati and Chicago both saw Class C rent growth near 4% — and both ranked below the U.S. average for new supply.
Most new construction tends to be Class A “luxury” because that’s what pencils out due to high cost of everything from land to labor to materials to impact fees to insurance to taxes, etc.
So critics will say: “We don’t need more luxury apartments!”
Yes, you do. Because when you build “luxury” apartments at scale, you will put downward pressure on rents at all price points.
Follow the people. This is why you can’t look at supply alone when evaluating apartment markets. It’s supply AND demand. Not just supply. And when you look at the latest Census data on where people are going (and leaving), isn’t it remarkable how well it lines up with apartment construction trends?
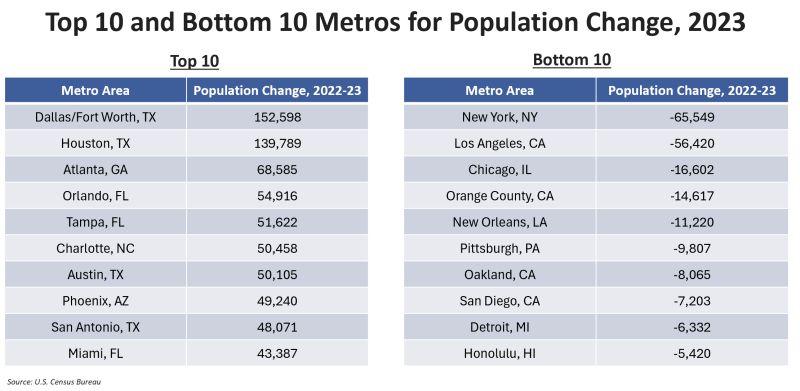
The top 10 metro areas for population growth for 2023 are all located in the high-supply Sun Belt. Texas claimed four of the top spots (DFW, Houston, Austin, San Antonio), followed by Florida with three (Orlando, Tampa, Miami), and one each from Georgia (Atlanta), North Carolina (Charlotte) and Arizona (Phoenix). Other Sun Belt metros coming close to the top 10 included Jacksonville FL, Nashville TN, Lakeland FL, Raleigh NC and Charleston SC.
What do all of those metros have in common? Several things– including A LOT of apartment supply.
Huge supply (record levels in many cases) are causing short-term digestion headaches — with rising vacancy and falling rents. But the population growth trends rather obviously point to strong rebound down the road as supply inevitably dwindles or even normalizes. The demand tailwinds haven’t evaporated. They’ve moderated or normalized since the initial COVID boom, but they haven’t gone away and likely won’t any time soon.
On the flip side, the markets losing population are probably no surprises. All are low-supply markets, but also low-demand markets. This isn’t to say apartment investors can’t be successful in these metros (after all, real estate is always local, local, local), and many certainly are quite successful. But at a macro level, I’d be leery of overplaying the “low supply” story when it’s paired with a “low demand” story.
This is a big reason why many Wall Street pundits whiffed on their West Coast outperformance outlooks last year. They doubled down too heavily on the “low supply” story, overlooking the facts that 1) the supply numbers were still elevated relative to recent history in these markets and 2) the demand story was mostly lackluster. The “undersupply” story is more nuanced than many analysts want to admit.
BUT a handful of coastal markets did see solid population growth in 2023– led by Washington DC ranking 11th nationally. Boston saw decent growth, too. Not coincidentally, DC and Boston have been the most consistent coastal core apartment performers, too. Seattle saw some growth, too.
(As an aside: I’m not a fan of simple ratios like population-to-supply. They’re not especially useful or predictive, and this is why vacancy numbers don’t align with population change. You can lose population and still see vacancy hold steady or even tick down. That’s because of household dynamics. For example, one family may decide to move out of a unit they’ve shared with another family. On the flip side, two roommates may split up to get more individual space. So while population is important, don’t look at it in a vacuum.) But that said…
What’s in store for multifamily investors in 2024? At a national level, multifamily real estate will continue to grapple with slowing growth in the number of new households while apartment supply surges. Rents will likely continue to grow, but more slowly than the long-run average. Meanwhile, vacancy rates are expected to stay at levels slightly above average in the post 2008 recession period, according to insights from Moody’s Analytics CRE.
One reason for optimism: a strong job market that has aided renters’ financial stability. A tight housing market with high interest rates may also continue to keep would-be homebuyers in the rental market.
That said, affordability remains an issue in many cities, said Thomas LaSalvia, Head of Commercial Real Estate Economics at Moody’s Analytics CRE. Nationwide, vacancies are expected to inch up to 5.5% this year, due to a larger-than-usual increase in new construction and slower-than-usual growth in the number of renter households, he said. That’s close to the average vacancy over the past 25 years.
Last but not least, investors are also still navigating interest rate uncertainty. As of February, the Federal Reserve paused interest rate increases and indicated a shift to lower rates could be coming in the year ahead.
While national trends matter, real estate is a local game. Read on for expert insights and key trends in four top apartment markets: New York, Chicago, Los Angeles and San Francisco.
New York
The 2024 outlook for New York’s multifamily market is “largely positive” due to strong fundamentals and properties that continue to perform well, despite the market volatility seen in 2023, said Brooke Richartz, Managing Director and Senior Regional Sales Manager for Commercial Real Estate at JPMorgan Chase.
New York’s vacancy rate was low in 2023 at 3.5%, even as more than 4,000 new apartment units were built, according to Moody’s Analytics CRE. But the market is expected to gain nearly 40,000 units by 2026.
Moody’s projects New York’s vacancy rate will rise to 3.7% by the end of 2024—up, but still healthy. The surge in supply could also leave renters “feeling more emboldened” to push back on rent increases or shop around, LaSalvia said. Inflation has also put some pressure on renters’ finances, Richartz said. Moody’s expects asking rents to grow 2% this year, up from 0.1% last year but slower than prior years.
Even with more supply, workforce housing is likely to continue to perform well in New York, Richartz said. While all major cities need more multifamily housing, the shortage of affordable and workforce housing is particularly acute.
“This demand allows rents and vacancy to be more durable compared to luxury rentals,” she said. “While luxury rentals are generally performing well, rent growth is stabilizing after seeing significant growth over the last year and a half, and we see rent concessions and vacancy rates starting to increase.”
Asking rent growth: 2% in 2024, up from 0.1% in 2023
Effective rent growth: 2.1% in 2024, rising from -0.4% in 2023
38,343 newly constructed units by 2026
Trend to watch
Moody’s forecasts the labor market and income growth will weaken in 2024. But unlike renters in other cities, those in New York looking to cut costs may not downsize to smaller units, LaSalvia said. “In New York where having roommates is well accepted, a weaker labor market and lower household formation—which can mean more roommate arrangements—can keep demand pressure on larger apartments,” he said.
An increase in hybrid and remote work can also make larger units, or units with access to extra common space, more attractive. Some property owners are adding more community spaces such as roof decks and yards, Richartz said. Others have added indoor communal workspaces, such as “phone booths” with Wi-Fi access—a particularly attractive amenity for renters sharing their living space, Richartz said.
Neighborhood highlights
The Bronx is “having a bit of a moment,” LaSalvia said. An influx of public and private investment over the past few years brought in new construction and new residents.
Brooklyn, on the other hand, stumbled a bit in 2023 after years of very strong performance.
“Affordability issues finally hit a head as value-focused households looked to emerging markets in Queens or the Bronx to find that ultimate mix of amenities, safety, proximity and price,” he said.
While San Francisco’s overall vacancy rate remains above its long-term average and rents haven’t quite bounced back to pre-pandemic levels, the multifamily market’s recent performance is heading in the right direction, Chen said.
“The lasting appeal of coastal and urban life remains,” she said.
Pockets of the city core are still seeing somewhat elevated vacancies and lower rents, said David Diggs, Managing Director and Senior Regional Sales Manager for Commercial Term Lending at JPMorgan Chase.
“But for the broader city and broader peninsula, things look solid and stable,” he said.
A spike in new construction, notably in the South of Market area, is contributing to San Francisco’s above-average vacancy rate, which is projected to rise from 4.2% in 2023 to 4.5% by the end of this year.
That could constrain asking rents, which are expected to rise 1.5% in 2024 after falling 2.2% last year, according to Moody’s. Rents at comparatively affordable units might be more affected than luxury apartments, which benefited from steady income growth in higher-earning households and demand from would-be homebuyers facing a challenging housing market, Chen said.
“Affordability is taking a bigger toll on the moderate- to low-income household,” she said.
Slower-than-usual rent growth could be a challenge for property owners also contending with inflation and higher costs, Diggs said. The Bay Area’s overall job market, however, has still shown growth despite some layoffs at technology companies during 2023.
Asking rent growth: 1.5% in 2024, up from -2.2% in 2023
Effective rent growth: 1.3% in 2024, rising from -1.9% in 2023
6,544 newly constructed units online by 2026
Trend to watch
Multifamily property values in Downtown San Francisco started to drop a bit during 2023. It wasn’t a dramatic decline, and the number of transactions is still low, “but we haven’t seen prices move lower in a long time,” Diggs said. “For investors who have capital, it could a good time to keep an eye out for opportunities.”
Neighborhood highlights
The South of Market neighborhood, San Francisco’s largest and most expensive multifamily submarket with the most new construction of luxury units, has struggled due to a comparatively sluggish return to the area’s office buildings and its higher prices, Chen said. On the other hand, the San Mateo and West San Francisco submarkets saw strong leasing in the second half of 2023.
The South Bay also had a particularly strong rebound after the pandemic and has continued to perform well, as have parts of the East and North Bay, Diggs said. That’s in part thanks to lifestyle changes accompanying hybrid and remote work.
“If people don’t need to commute in as much, they’re OK living farther away,” he said.
After crusading for years for investment funds and companies to take into account environmental, social and governance factors, BlackRock, the world’s biggest asset manager, is changing its approach. Instead, the company is directing billions of client dollars toward infrastructure projects that will help speed the transition from fossil fuels. The strategy is called ‘transition investing’ and offers steady returns and measurable benefits for fighting climate change.
The change of approach makes a lot of sense given the company’s $12.5 billion purchase of Global Infrastructure Partners in early January. Blackrock is bringing the resources in house to pivot to a potentially ESG adjacent investment product that’s marked by measurable impact as opposed to hard to quantify social issues and inconsistent environmental standards. Infrastructure investing is hot and Blackrock is looking to make a quick impact.
Florida’s population grew by 5% between April 2020 and July 2023 as shifting work patterns and the allure of a better overall quality of life have fueled relocation interest to the state despite headwinds to affordability.
Even though concerns over escalating insurance costs – particularly in coastal areas – and elevated interest rates have forced many to hit the pause button, it has not stopped a flood of new residents from moving to Florida.
In terms of total migration in 2022, those relocating from New York comprised the largest share of the new population gained, with more than 91,000 residents choosing to become Floridians. California was next, with nearly 51,000 residents moving to the Sunshine State, and New Jersey rounded out the top three with 47,000 of its residents making the move South. The new residents from New York and New Jersey comprised 0.5% of the overall population of those states, as opposed to the 0.1% leaving California. Other states with outbound migration to Florida totaling more than 30,000 people include Georgia, Texas, Pennsylvania, Illinois and Virginia.
To be precise, the population change is not all due to inbound growth, however, as dwindling affordability has made Florida a less attainable long-term home for many. A report from Placer.ai found that roughly 14% of all in-migration to North Carolina came from Florida, perhaps a continuation of the “halfback” phenomenon, where residents relocate from New York to Florida and then move halfway back.
While the Orlando, Tampa and Jacksonville markets have attracted their share of attention for their rate of population growth since 2019, Florida’s real stalking horse market lies in the southwest part of the state. The Placer.ai report determined that growth in the North Port-Sarasota-Bradenton area is resulting in it emerging as one of the “fastest-growing midsize metropolitan areas in the nation.”
That being said, about 20% of the population migration into the area is being driven by residents relocating from other areas within Florida. Of those residents, the largest number are coming from the nearby Tampa area, at 7.6%, followed by Punta Gorda, at 4.2%, South Florida, at 3% and the Orlando area, at 2.5%. Many of these areas have experienced a surge in home prices in the past few years, resulting in diminished affordability.
Oxford Economics has also reported that one of the strongest levels of in-migration from seniors aged 65 and over has taken place in several Florida areas, including The Villages, Punta Gorda, Sebastian and Naples. The Jacksonville area also ranked in the top 25 areas in the U.S. for the fastest increase in its senior population over the past five years.
Despite seeing slower population growth than its northern peers, South Florida is expected to continue to gain residents over the next few years, many of whom are expected to relocate to the area as they retire after the age of 65. Still, population gains are set to slow from pre-pandemic growth of over 1% annually from 2010 through 2019 to less than 1% over the coming five years.
A lack of housing affordability, with South Florida ranking as the eighth-least-affordable single-family home market in the nation, according to the National Association of Realtors, along with above-average inflation, continues to affect demographic gains.
That said, Miami-Dade was the second most popular county in the nation to start a business in 2022, after Los Angeles, and South Florida’s labor market remains strong, with tight unemployment rates and continued labor force growth. Company relocations, along with elevated venture capital investment, continue to drive job growth in the area. In fact, according to the Miami-Dade Beacon Council, commitments from 57 companies looking to expand or relocate to the County were secured in 2022.
Going forward, a tight labor market, along with an inflow of high-net-worth individuals, will continue to place pressure on living costs in the area. Additionally, structural issues concerning housing availability will further bolster inflation above the U.S. average. Single-family home construction has remained limited over the last cycle relative to 2005-07 levels, and Miami continues to have the highest levels of vacation homes in the entire country, contributing further to the limited availability of housing for residents.
A rise in condo and apartment construction has tried to fill the gap between housing demand and availability, though most new condos are concentrated in luxury developments, and apartment rents have risen significantly since the pandemic. These factors will pressure lower-income households out of the South Florida area, as has been the case over the last few years, while those who decide to stay will continue to opt towards renting as homeownership in the area remains unattainable.
The year 2023 was an especially tough one for real estate. Declines in asset valuations, which had begun in the second half of 2022 in many markets, proliferated across a broader range of markets through the rest of 2023. Transaction volume also continued to fall through the year, with dealmaking often paralyzed by the standoff between potential buyers and sellers on pricing.
Investors will be hoping for a better 2024, where we find a floor in pricing that will return the market to more-normal levels of activity. When and how that happens remain to be seen. It may be through increased distress forcing sellers onto the market. Or we might eventually see interest rates start to fall, returning confidence to potential buyers. Whatever the details of exactly when and how we reach that point, the sudden market movements we’ve seen over the last 12 to 18 months have shifted the playing field. Investors are reassessing their real-estate allocations and strategies to mitigate significant risks but also exploit opportunities posed by this market dislocation.
The heady mix of various structural and cyclical trends buffeting the market creates an investment landscape characterized by great diversity in risk exposures and hence expected returns. In this blog post we present some of the trends that we see, to help investors navigate this challenging environment through 2024.
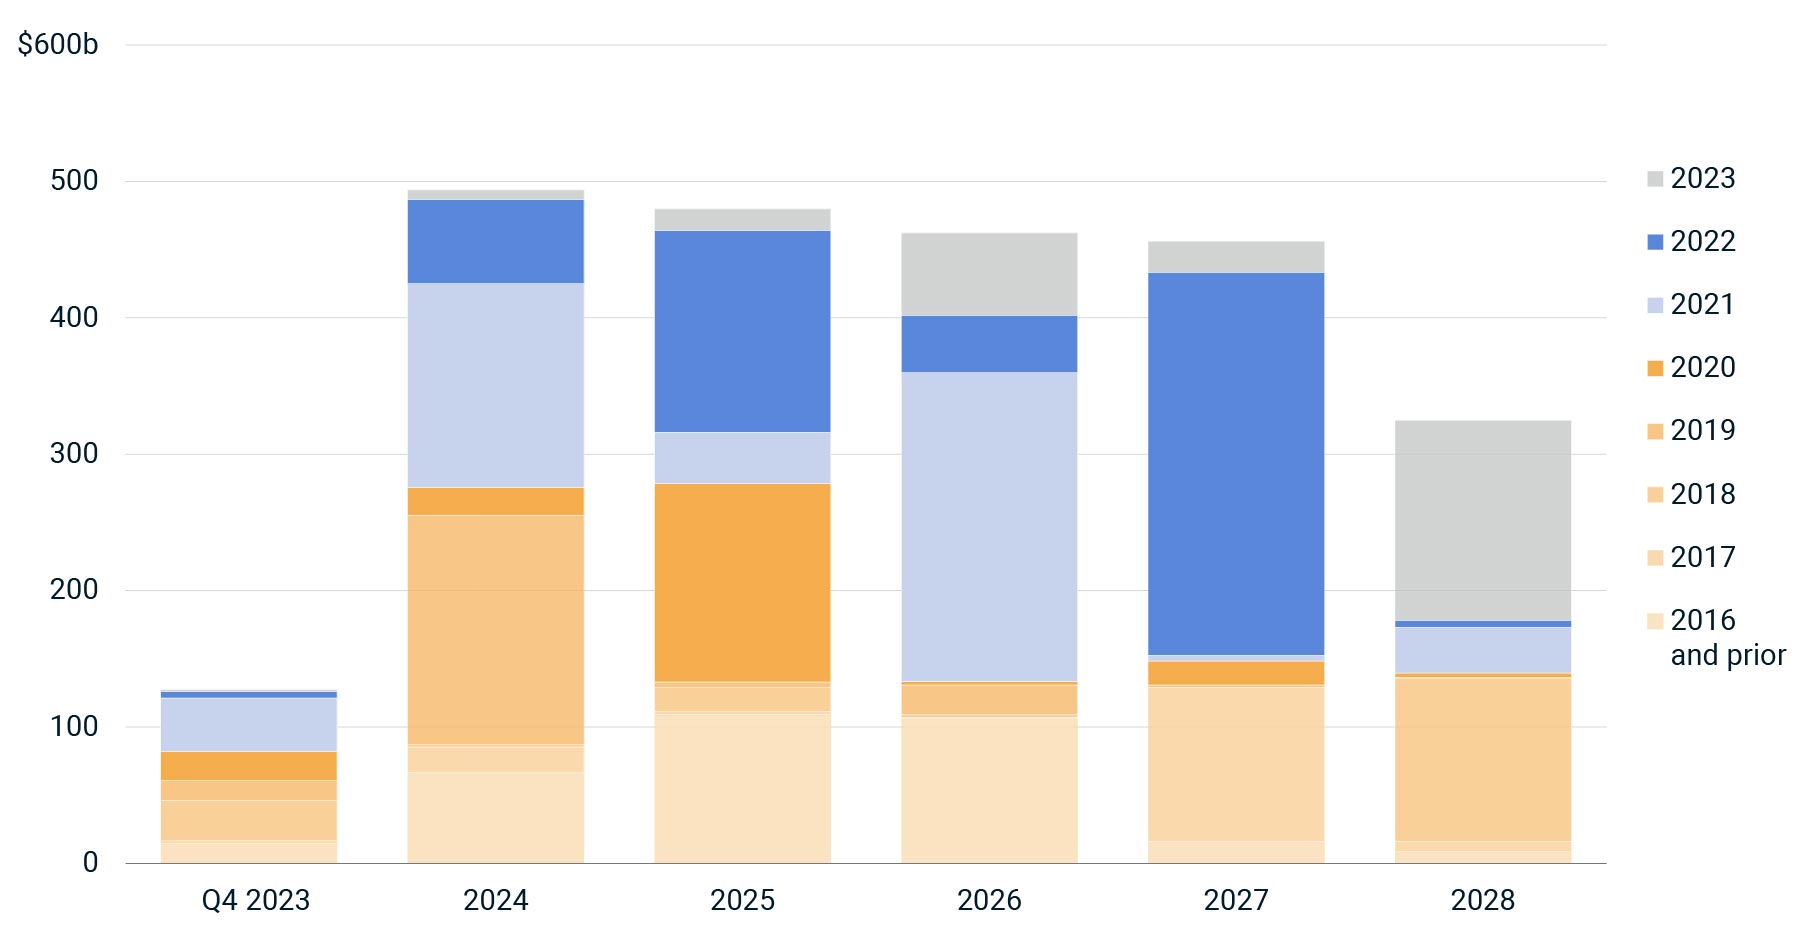
1/ Distress starts to bite as loans mature
Distressed sales have represented just a small fraction of the U.S. market in 2023, at a 1.7% share of investment, despite steady growth in distress levels since 2022. Still, there is reason to believe that more forced capital events, including sales of distressed assets, could be on the way.
The wave of loans facing maturity, and the timing of when these loans come due, could lead to additional forced selling. The most problematic loans are those originated at record-high property prices and record-low mortgage rates, which is the case for many of the loans originated in 2021 and 2022. Many of the loans from these vintages had shorter-term durations: For instance, of the 2021 loans that remained outstanding at the start of Q4 2023, 67% are slated to come due by 2027. As these loans mature, some investors will struggle to rebalance their capital structures in an environment of higher interest rates and lower valuations.
More-conservative lending terms will likely force such capital events: Commercial loan-to-value ratios (LTVs) for 7- to 10-year fixed-rate products averaged 57% in 2023, down two percentage points from 2021; LTVs for multifamily assets have declined more. With more than USD 2 trillion in loans set to mature through 2027, as the cost of capital reverts to a more historically typical level and lenders continue to tightly manage risk, additional opportunities will be revealed for investors looking to pick up assets on the cheap.
Still, because of the structure of the financing market in the years since the 2008 global financial crisis (GFC), this down cycle may afford more flexibility for lenders and borrowers than in the aftermath of that calamity. Then, rebalancing often took the form of foreclosures by purchasers of loans and sales out of distressed situations by the special servicers. Today, there are investors looking to new vehicles for rebalancing.
Looming US loan maturities
Loan maturities by origination vintage. Loans outstanding at Q4 2023. Data as of Dec. 5, 2023. Source: MSCI Mortgage Debt Intelligence
2/ Mind the gap: Buyers and sellers need to meet
The current illiquidity in many global transaction markets is largely due to the pricing uncertainty caused by the sharp rise in interest rates following years of benign rates. There is less agreement between buyers and sellers on where properties should be priced, meaning that fewer deals have been completed.
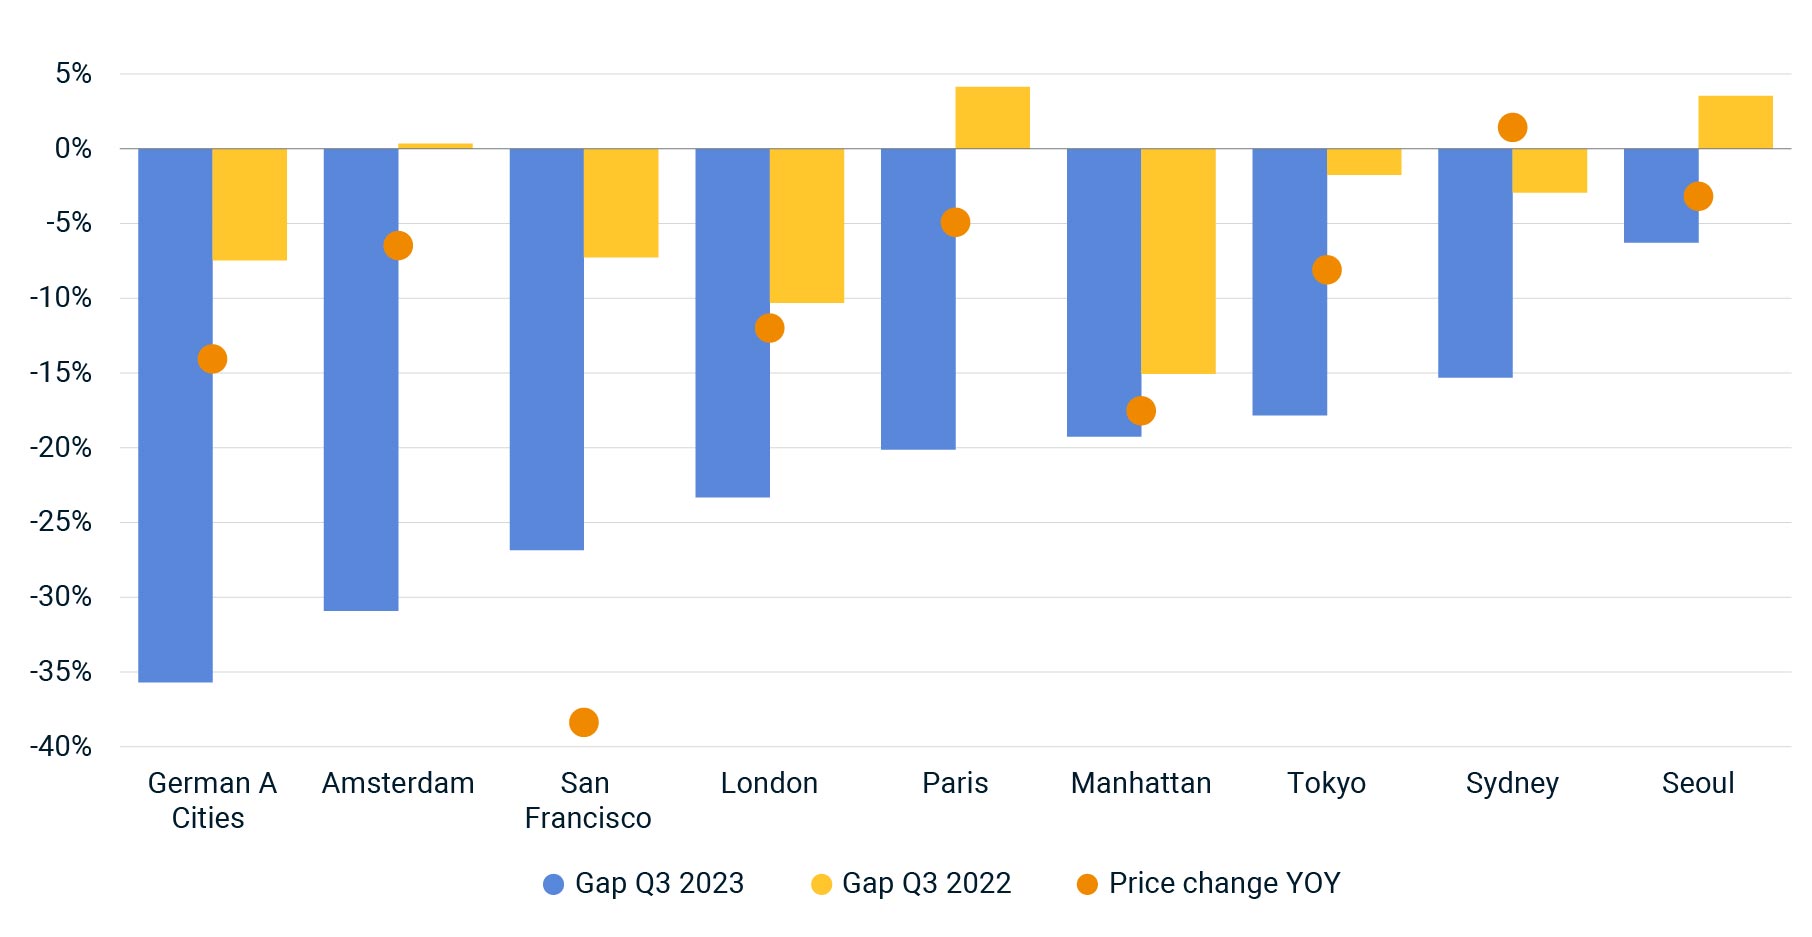
The scale of the price gap that needs to be bridged to bring market liquidity back to its long-run average, as shown by the MSCI Price Expectations Gap, has grown significantly for some of the major European and North American office markets. (This analysis shows that offices are, on average, faring worse than industrial or residential property.)
The price gulf for offices in the German A-cities has grown to -36% in Q3 2023 from -7.5% a year prior, which comes on top of a 14% drop in transaction prices over the same period. This indicates that buyers would require an even larger discount than that currently on offer to come back into the market. A similar dynamic is on display in San Francisco, where the gap has grown to -27% on top of a substantial drop in transaction prices.
For greater liquidity to return to the transaction market, there has to be greater agreement on where property should be priced, which requires some more clarity on the trajectory for interest rates. If investors expect that, with inflation falling, central banks are largely done with the tightening cycle, this may allow buyers and sellers to move closer together. In the meantime, mind the gap.
Difference in buyers’ and sellers’ pricing views has widened
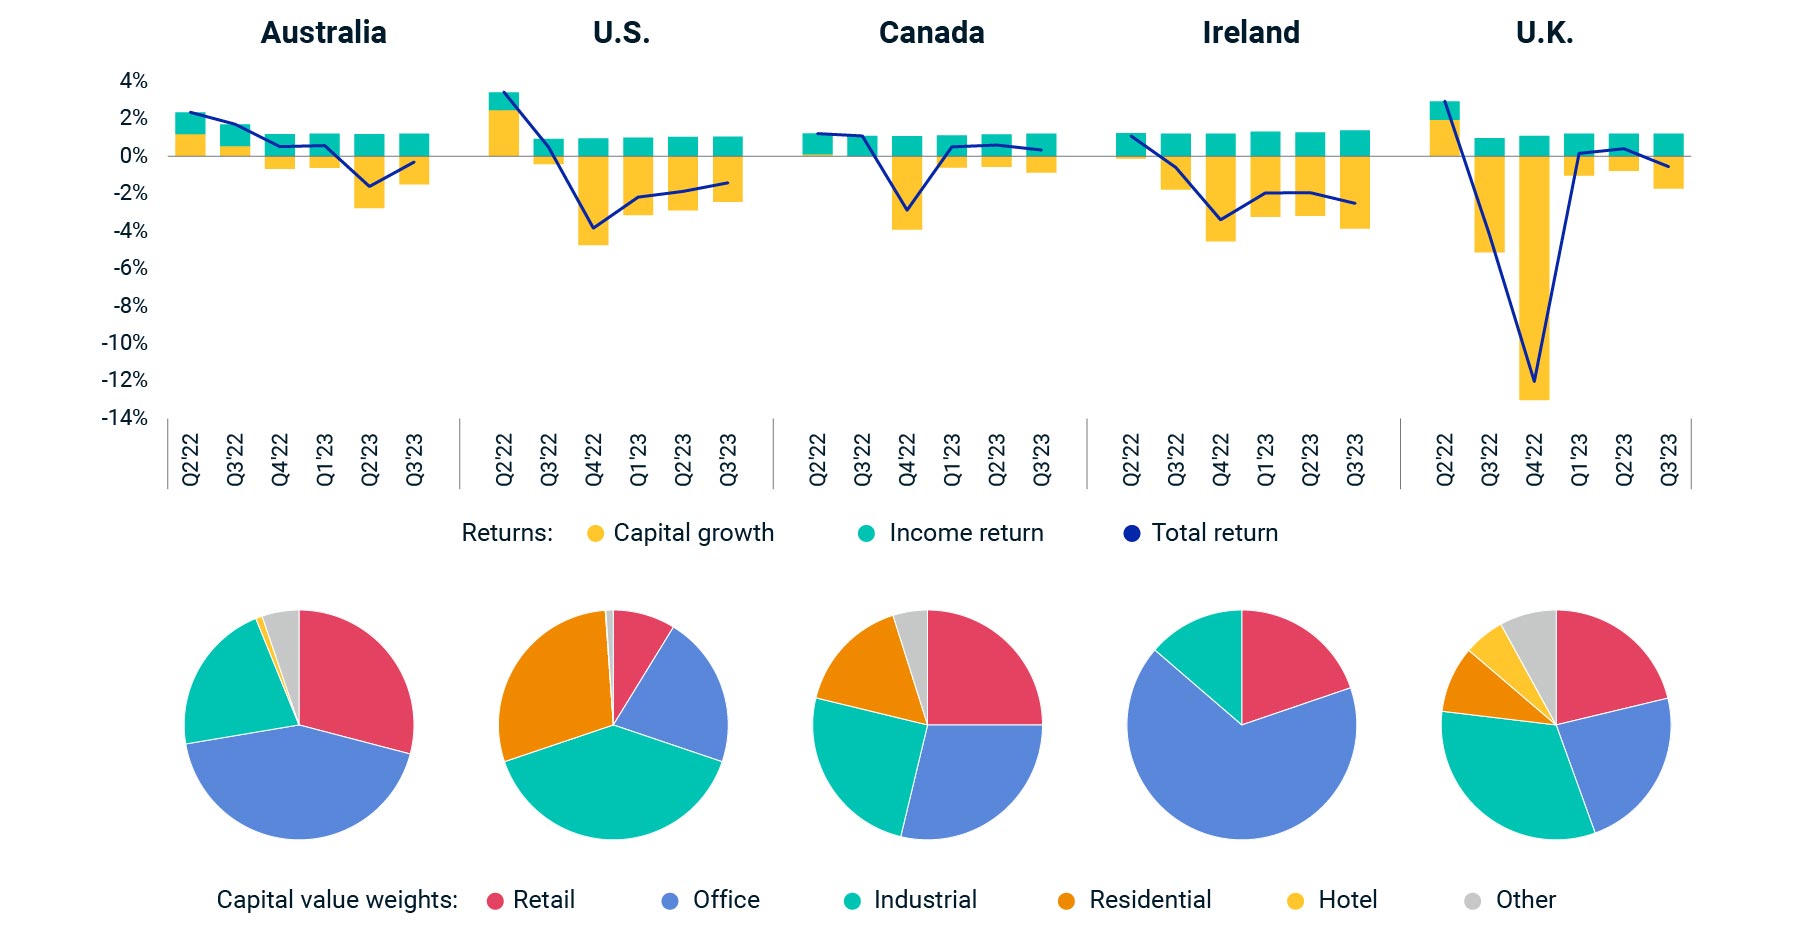
The turbulent last few years in commercial real estate has made calling the bottom of the investment cycle even more difficult than usual. A double dip in property performance after the initial interest-rate-led declines of late 2022, cannot be ruled out due to factors including higher-for-longer rates and weakening global economic growth.[1] Weakening tenant demand in the office sector is also a key factor.
The biggest influence on the swings in property performance is capital growth, which in turn is driven by pricing. One signal on pricing is provided by the MSCI Price Expectations Gap. This analysis indicates that of 143 market segments measured in Q3 2023, 99 will need further price reductions to restore liquidity to long-run averages. Such adjustments, in turn, could trigger further valuation drops.
Furthermore, the biggest reductions appear necessary in office properties, with an average gap of just under 17% across all office markets covered. A closer look at some of MSCI’s quarterly indexes shows that several markets, such as Australia and Ireland, are heavily weighted toward the office sector, so if these price reductions occur, they could trigger a negative impact on capital growth once transactions start happening.
First dips in property performance already experienced
Capital value weights as of Q3 2023. Source: MSCI UK Quarterly Property Index, MSCI/SCSI Ireland Quarterly Property Index, MSCI/REALPAC Canada Annual Property Index (Unfrozen) Published Quarterly, MSCI U.S. Quarterly Property Index (Unfrozen), The Property Council of Australia/MSCI Australia Annual Property Index (Unfrozen) Published Quarterly
4/ Investors grapple with a rapidly shifting risk/return landscape
Global real estate investing has undergone a notable shift over the past year and a half, and changes in the economic and financing landscapes have altered investors’ perceptions of value across and within asset classes. This change is especially true for real estate, which is influenced more directly by debt-financing and interest-rate impacts, as well as by the broader, indirect impact of rising risk-free-rate benchmarks against which all asset classes are priced. Investors are also reassessing capital allocations within real estate due to evolving risk and opportunity dynamics. These are driven by the varied way evolving cash-flow expectations and asset repricing have hit differently across various dimensions of the market. Risk — from core to opportunistic strategies — is one key dimension.
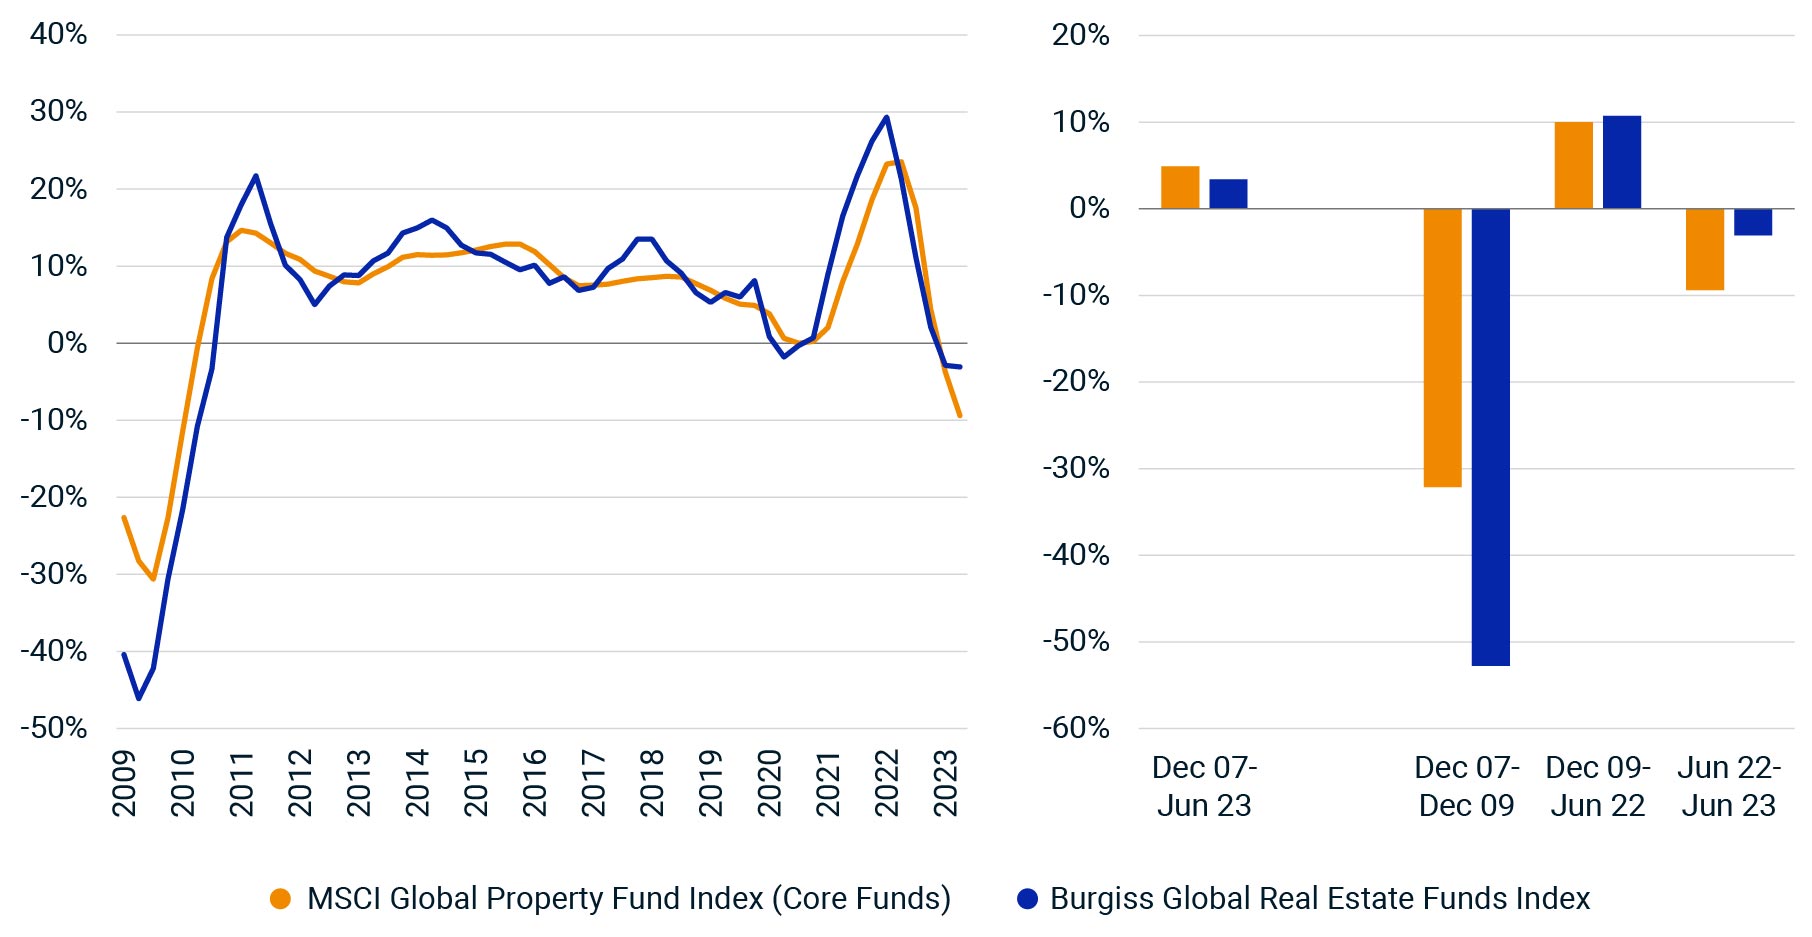
Against this backdrop, it’s valuable to view the return characteristics of core, open-end funds versus closed-end funds, which are heavily dominated by value-add and opportunistic strategies. From December 2007 to June 2023 the Burgiss Global Real Estate Funds Index marginally underperformed the MSCI Global Property Fund Index (Core Funds) by 150 basis points (bps) per year, though this was mainly driven by significant underperformance during the GFC. Over the intervening period up to June 2022, the Burgiss index outperformed the MSCI index by 70 bps per year and in the latest downturn (12 months to June 2023) posted returns of -3.1%, vs. -9.4% from the MSCI index.
Core investments have lagged so far in the current downturn
Fund returns. Source: Burgiss Global Real Estate Funds Index, MSCI Global Property Fund Index (Core Funds)
… For complete article, CLICK HERE <— MSCI has this research and others like it for you to visit.
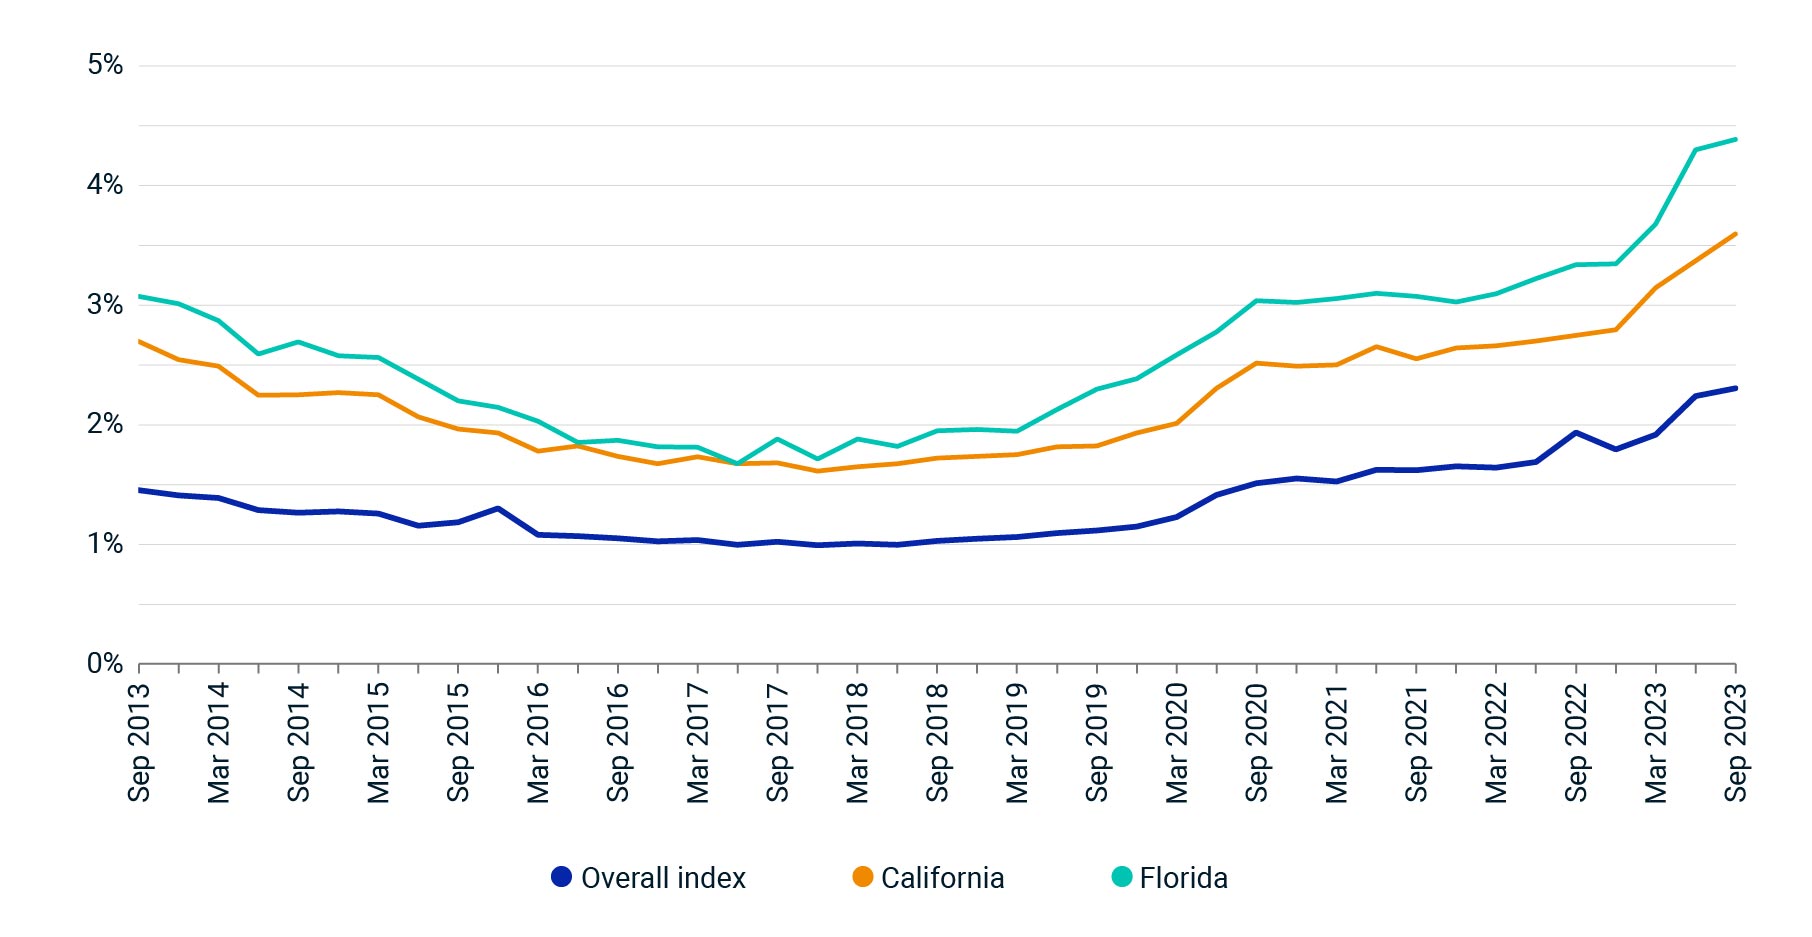
US insurance costs have increased, particularly in high-risk states
Insurance costs as share of income receivable. Source: MSCI U.S. Quarterly Property Index
Footnotes
“World Economic Outlook.” International Monetary Fund, October 2023. ↩
“Science points to ‘climate collapse’ as UN chief calls COP28 to action.” United Nations, Nov. 30, 2023. ↩
Using a REMIND, 1.5°C, SSP2, Orderly scenario for transition risk and a REMIND, 3°C, Current Policies, Aggressive Outcome for physical risk. ↩
Konrad Putzier. “Surging Insurance Costs Have Come for Office Landlords.” Wall Street Journal, Sept. 25, 2023. ↩
Top 5 Florida Multifamily Markets for Investment in 2023
Analyzing rent trends, employment data, and population growth, we’ve determined the five multifamily markets with the best potential upside for investors in 2023.
Investing in Florida’s multifamily real estate market can be tricky. Many of you have undoubtedly seen the highs and lows, watched investors rush in, and observed the challenges they face.
The big question: Where to invest in 2023? While opinions are many, reliable data is the key to clear answers.
In this article, we use solid metrics and real-world experience to identify the top five Florida markets with the best potential for returns. Let’s dive into these markets and understand what the numbers are really telling us.
Methodology
To rank Florida’s top multifamily markets, we focused on five key factors:
Year-over-year rent growth
Projected rent growth
Unemployment rate
Average multifamily pricing
Population growth
Key Takeaways
Florida’s top multifamily markets are defined by economic stability, growth prospects, and robust rental demand.
Miami, while offering premium investment opportunities, also commands the highest prices in the multifamily sector.
Be sure to keep track of current multifamily loan rates to secure the most advantageous terms for your property investment.
Data-driven insights and market reports provide valuable guidance, but individual investment discernment is crucial.
While cities like Orlando and Fort Lauderdale are rising stars, investors must evaluate both the broader market trends and specific opportunities within each city.
The rent figures were sourced from Yardi Matrix’s latest multifamily report. Based on these factors, each market was given a score, with considerations weighted for their impact on potential investment returns.
The Top 5 Florida Multifamily Markets
Rank
Market
Unemployment Rate
Annual Population Growth
1
Miami
1.90%
0.23%
2
Fort Lauderdale
3.00%
0.66%
3
Orlando
3.10%
2.04%
4
Boca Raton/Palm Beach
3.30%
2.34%
5
Tampa/St. Petersburg
3.10%
1.78%
1. Miami
As a bustling hub of culture, finance, and international trade, Miami has long been a focal point for investors. Its strategic position as a gateway to Latin America has accelerated urban development, with an influx of multifamily units catering to a diverse and growing population.
While it commands premium pricing in the multifamily market, many investors are drawn to Miami for its potential growth and vibrant economic landscape. Further, it’s also one of the cities in the U.S. with the greatest need for new housing. This supply-demand imbalance is a boon for any active investors in the market.
Key Strengths
Miami has exhibited strong and consistent rent growth year over year.
The city’s projected rent growth underscores its potential, aligning with insights from Yardi Matrix’s multifamily report.
While it’s the priciest market on our list, many investors see value in its long-term potential and the allure of its metropolitan dynamics.
2. Fort Lauderdale
Fort Lauderdale, traditionally known for its beaches and boating canals, has seen a transformation in its downtown and arts districts. The city is evolving into a more urban, walkable environment, attracting a younger demographic seeking live-work-play environments. This shift, combined with its proximity to Miami, positions Fort Lauderdale as an attractive market for multifamily investors.
Key Strengths
Notable year-over-year growth.
Upward trajectory in projected rents.
Balanced mix of price points for multifamily investments and a favorable employment landscape.
3. Orlando
Orlando, beyond its reputation for world-class theme parks, boasts a rapidly growing downtown and tech industry. The city’s strategic initiatives to diversify its economy beyond tourism have resulted in a surge of young professionals. This influx, combined with its universities and growing tech hubs, creates sustained demand for multifamily residences.
Key Strengths
Strong growth metrics both year-over-year and in projected rent growth.
Diverse range of multifamily price points.
Positive employment figures underlining its potential.
4. Boca Raton/Palm Beach
Boca Raton and Palm Beach, traditionally luxury markets, are experiencing a renaissance with new multifamily developments catering to a wider range of incomes. Their appeal, stemming from a mix of upscale shopping, cultural venues, and top-tier educational institutions, attracts both families and young professionals. As these areas continue to evolve, they present unique opportunities for multifamily investors.
Key Strengths
Consistent growth positioning them as markets to watch.
Aligned projected rent growth with leading industry reports.
Varied multifamily investment opportunities and a positive employment outlook.
5. Tampa/St. Petersburg
Tampa and St. Petersburg, nestled on Tampa Bay’s coast, offer a blend of historic charm and modern development. Their urban cores are experiencing revitalization, with new multifamily projects catering to their growing populations. The cities’ focus on infrastructure development, combined with a thriving arts scene and booming job market, makes them appealing to a broad demographic. There are some strong peripheral or tertiary communities which are on the Top 25 cities in Florida list.
Key Strengths
Encouraging growth trends.
Positive projected trajectory for rents.
Blend of multifamily pricing options and stable employment figures.
Conclusion
The best multifamily markets in Florida offer a mix of stable economic indicators, promising growth, and strong rental demand. These factors, from employment rates to projected rent increases, point to where investors might find reliable returns.
Yet, it’s crucial to remember that every investment is unique. While there are undoubtedly excellent opportunities in top-tier markets like Miami, there are also pitfalls to avoid. The same goes for other Florida cities, including those not on our list.
Investing in real estate isn’t just about recognizing a city’s potential; it’s about discerning the right opportunities within it. As we’ve looked into these top markets, the overarching message is clear: Understanding a market means both analyzing its broader trends and being discerning about individual investments.
If you have considered selling and would like an analysis or valuation of your property, then Let’s Connect!
I have put the majority of this article written by Rebecca on our site as Casey Babb is one of the top brokers in our industry and among many personable and trustworthy brokers and agents, Casey is one of the best in my humble opinion.
The Tampa Bay area has gone from a hidden gem to one of the hottest destinations in the country. But as more people have moved here, rent has increased consistently. Since 2018, rent has spiked 38% in Tampa and 36% in St. Petersburg according to data from the real estate firm CoStar.
Casey Babb is an executive vice president for Colliers in Tampa who focuses on multi-family housing. He said the past couple of years have brought a flood of investment to the region, with developers buying up land as fast as they could.
But now, the multi-family market has slowed substantially. Transaction volume dropped 64.8% year over year in the first quarter of this year, according to data from Colliers.
What does this mean for developers and for renters? Babb shares his predictions for the local market in this interview.
Casey Babb is an Executive Vice President for Colliers in Tampa. [ Colliers ]
How has the multi-family housing market changed in the past year?
The market was headed on a very dangerous track that was going to eventually come off the rails. It was not sustainable, the things that were happening in our world. Property values shot through the roof. Rents obviously shot through the roof as well, which is good for landlords, bad for tenants.
But (the Federal Reserve has) raised rates substantially, which has slowed everything down. That’s produced a kind of a shock to the system.
There’s a lot of landlords out there that bought compressed cap rates. Their whole business plan was centered around adding value to the property and then selling one day at a profit. Now that whole plan is kind of on fire and they’re backpedaling and playing defense and trying to figure out how to just get their money out.
There’s a lot of interesting things happening out there. The markets have been very quiet. It’s very difficult to transact business in Florida.
Are there any challenges that are unique to our local market?
There’s an absolute insurance crisis unfolding here in Florida. Depending on the property, depending on the type of construction, the location, your insurance has gone up between three and five times. And that’s just in the last, really in the last six months.
It was already starting to get bad and then Hurricane Ian and Hurricane Nicole both compounded the problem. So that is really kind of on top of everything else making it a very difficult market for everyone here.
Our area is not the easiest to develop in. Looking at Pinellas County and most of Hillsborough County, at this point it’s built out. So you literally have to knock something down and repurpose the site in order to manufacture new housing. There’s not a lot of vacant land just laying around.
We’ve got a lot of water obviously. There are a lot of environmental concerns with wetlands.
Developers really cannot build fast enough in our area.
Given all these challenges, what will the next few years look like? Will multi-family construction come to a halt?
There are still lots of cranes in the sky right now. If you drive around, you will inevitably see apartment complexes being built. That’s because it was an absolute land grab like no one has ever seen in 2020, particularly 2021.
Most of the projects that you see underway got their financing and their permits and everything together before September or October of last year. So they were able to lock in a lower interest rate.
But if you missed that window, your project might be delayed.
So what you’re going to see is basically a wave of supply hitting this year and into 2024. And then that’s gonna be followed by not a whole lot in 2025. That’s because the deliveries of these apartment complexes tend to lag about two years behind what’s actually happening in in the current economy
How have rising rents impacted Floridians?
Post-COVID, (rents) have gone up probably 50% on aggregate. That’s a substantial increase Meanwhile, wages have not kept up.
In a place like Tampa it’s very common to see teachers and firefighters and police having to live and commute in from Pasco and Hernando County where they can find housing that fits their budget. That is a major problem for an economy, for a society.
How can we solve that problem?
A new law called the Live Local Act was just passed a few weeks ago. It does a number of things. It preemptively bans rent control, which investors and developers love and it will cause them to produce more housing in general. You’re now going to have a streamlined process as a developer to maybe take a commercially zoned site and build multifamily with 40% of the units set aside for affordable/workforce/attainable housing.
If developers are setting aside affordable housing within their project, they can also get substantial tax breaks.
Local municipalities are figuring out how to implement this into their comp plans. And there’s a lot of question marks because it hasn’t even taken effect yet. It’s going to be a very interesting process in terms of how it unfolds.
We’ll still be grappling with the same expensive cost of capital in the near term. But long term, this law will absolutely produce lots and lots and lots of housing. And that has proven to be the best antidote for housing prices. More supply will bring prices down. Less supply has the opposite effect.
Such interesting content and research that I wanted to share a city in my backyard. Great work Apartment List.
Tampa Rent Report: May 2023
Welcome to the Apartment List May 2023 Rent Report for Tampa, FL. Currently, the overall median rent in the city stands at $1,702, roughly the same as last month. Prices remain down 0.3% year-over-year. Read on to learn more about what’s been happening in the Tampa rental market and how it compares to trends throughout the broader Tampa metro area and the nation as a whole.
Tampa Rental Stats
Median Rent
1 bed
$1,404
2 bed
$1,732
Rent Growth
Past month
+0.2%
Past year
-0.3%
Tampa rents are flat month-over-month and flat year-over-year
The median rent in Tampa rose by 0.2% over the course of April, and has now decreased by a total of 0.3% over the past 12 months. Tampa’s rent growth over the past year has is similar to the state average (0.7%) but has fallen below the national average (1.7%).AprMayJunJulAugSepOctNovDecJanFebMarApr-2 %-1 %0 %+1 %+2 %+3 %+4 %+5 %% Rent GrowthTampa Rent Growth Over Past 12 MonthsUS: +1.7%Florida: +0.7%Tampa: −0.3%
Tampa rent growth in 2023 pacing below last year
Four months into the year, rents in Tampa have risen 1.1%. This is a slower rate of growth compared to what the city was experiencing at this point last year: from January to April 2022 rents had increased 2.2%.JanFebMarAprMayJunJulAugSepOctNovDec-5 %0 %+5 %+10 %+15 %+20 %+25 %+30 %+35 %Annual Change in Median RentTampa, FL: 2019 – Present% Rent growth since January2021: +30.9%2019: +3.5%2020: +2.8%2023: YTD +1.1%2022: +1.1%
April rent growth in Tampa ranked #64 among large U.S. cities
Tampa rents went up 0.2% in the past month, compared to the national rate of 0.5%. Among the nation’s 100 largest cities, this ranks #64. Similar monthly rent growth took place in San Francisco, CA (0.2%) and Arlington, TX (0.2%).
Month-over-Month Rent Growth Among 100 Largest Cities In the U.S.
-2 %-1 %0 %+1 %+2 %#64. Tampa, FL (0.2%)US Average (0.5%)#1. New York City, NY (1.9%)#100. New Orleans, LA (-1.1%)
Tampa is the #25 most expensive large city in the U.S., with a median rent of $1,702
Citywide, the median rent currently stands at $1,404 for a 1-bedroom apartment and $1,732 for a 2-bedroom. Across all bedroom sizes (ie, the entire rental market), the median rent is $1,702. That ranks #25 in the nation, among the country’s 100 largest cities.
For comparison, the median rent across the nation as a whole is $1,162 for a 1-bedroom, $1,332 for a 2-bedroom, and $1,355 overall. The median rent in Tampa is 25.6% higher than the national, and is similar to the prices you would find in Chandler, AZ ($1,766) and Seattle, WA ($1,693).
Median Overall Rent Among 100 Largest Cities In the U.S.
#25. Tampa, FL ($1,702)
US Average ($1,355)
#1. Irvine, CA ($3,028)
#100. Cleveland, OH ($796)
Tampa rents are 3.3% higher than the metro-wide median
If we expand our view to the wider Tampa metro area, the median rent is $1,647 meaning that the median price in Tampa proper ($1,702) is 3.3% greater than the price across the metro as a whole. Metro-wide annual rent growth stands at -0.9%, below the rate of rent growth within just the city.
The table below shows the latest rent stats for 9 cities in the Tampa metro area that are included in our database. Among them, Wesley Chapel is currently the most expensive, with a median rent of $2,082. Largo is the metro’s most affordable city, with a median rent of $1,517. The metro’s fastest annual rent growth is occurring in Largo (0.7%) while the slowest is in Wesley Chapel (-4.8%).


You must be logged in to post a comment.